
I love this chart.
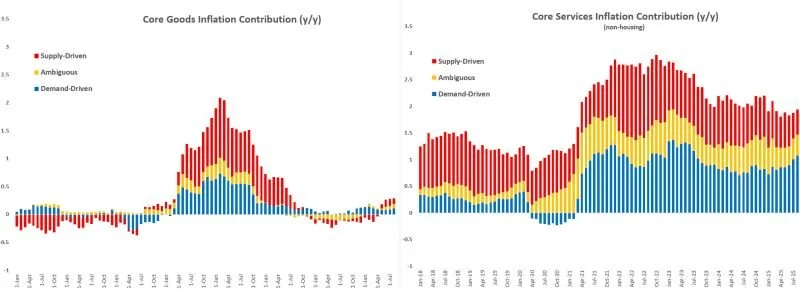
It helps show two things being true at once. One is that we’re seeing inflationary pressures in goods and goods-producing sectors.
The other is that broad-based inflation is elevated but not as high as some expected, because it’s mostly driven by a return to higher spending share in the service sector.
Unlike COVID, our share of goods spending is back to pre-pandemic levels, so goods inflation isn’t pushing the overall total as much—even though it’s still elevated.
I remember Austan Goolsbee talking about the old equation: roughly 2% services price growth + 1% housing - 1% goods deflation nets you the target 2% overall. We’re at 2.9% PCE.
Basically, goods can’t do their usual job of being deflationary because of tariffs and supply pressures. So while goods aren’t driving high inflation on their own, they’re also not providing the deflationary offset that would normally pull us down to a comfortable 2%. That’s what’s helping keep inflation sticky above target.