
Every Bubble Feels Different, Until It Ends the Same Way
Every era believes its boom is different. Yet the history of asset bubbles since 1977 tells a remarkably consistent story.
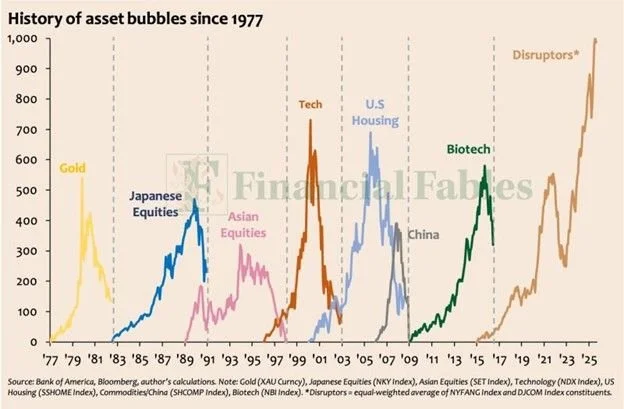
From gold in 1980 to Japanese equities in 1989, from tech in 2000 to U.S. housing in 2007, each cycle has followed the same emotional rhythm—an idea that begins in truth, is amplified by liquidity and belief, and ends when expectations outrun reality. The chart from Bank of America and Bloomberg illustrates this rhythm vividly. Every great speculative surge shares the same trajectory: early scepticism, euphoric adoption, and eventual disillusionment.
Today’s “Disruptor” complex—an equal-weighted basket of the NYFANG and DJCOM indices—has risen nearly 1,000% since 2015, eclipsing the magnitude of prior manias. The underlying technologies are transformative, but so were the innovations that powered every past bubble. What changes is not the promise of progress, but the price investors are willing to pay for it.
The current pattern resembles late-stage enthusiasm: stretched valuations, concentrated leadership, and investors crowding into a narrow theme under the banner of inevitability. This doesn’t imply an imminent crash, but it does suggest diminishing asymmetry, more risk for less reward.
For disciplined investors, the lesson of four decades is clear. Every cycle ends with conviction, and every reset begins with disbelief. We believe in participating in bull markets, for history instructs that’s where the most money can be made. But investors must also be mindful that all trends, bullish or bearish, eventually end. Stay alert for signs of trend change and remember that the leaders of the next bull market will likely be different from the last. The best investments of the next few years are currently standing just out of sight of consensus opinion.