
What Would Robert Shiller Say?
The Shiller P/E compares equity prices with the inflation-adjusted average earnings of the past ten years and is widely regarded as one of the most insightful indicators of market exuberance.
While many investors increasingly reach for the word “bubble,” Robert Shiller — one of the two creators of the Shiller P/E — remains strikingly measured in his assessments.
Shiller publishes the ratio monthly, drawing on data that stretches back to 1881. This unusually long historical record is precisely what gives the indicator its enduring relevance.
The Shiller P/E is not designed to time markets.
But its message is remarkably consistent.
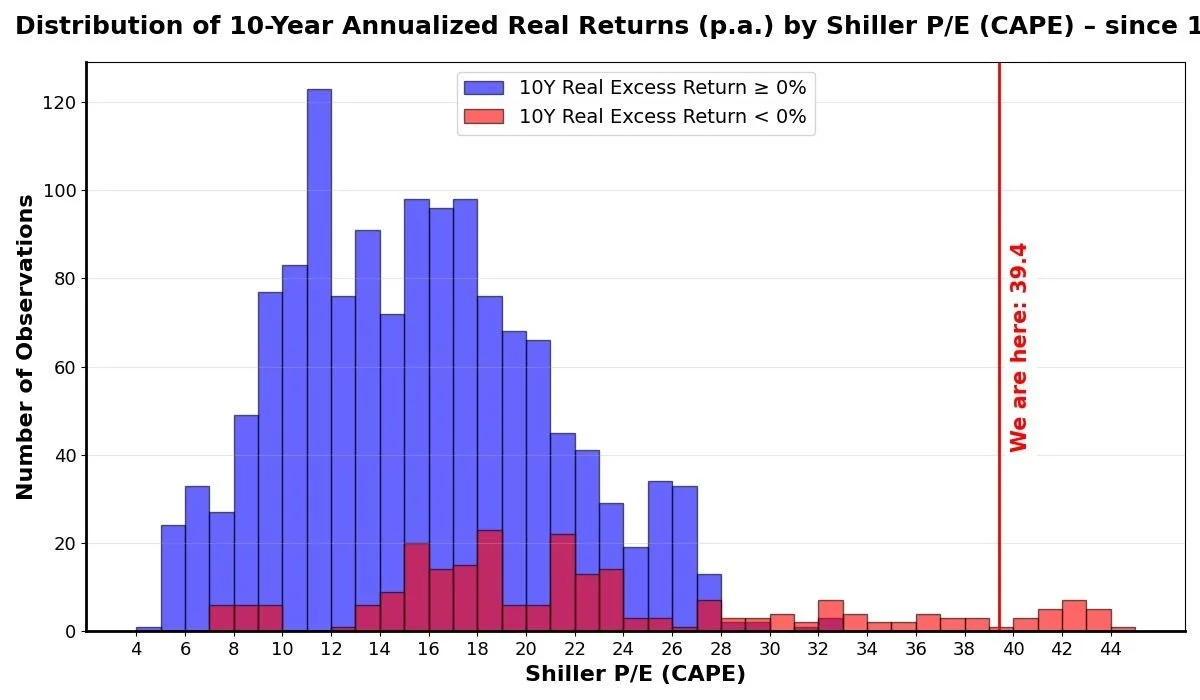
Whenever the Shiller P/E has reached very elevated levels, subsequent 10-year real, annualized excess equity returns relative to long-term bonds have historically been negative — as illustrated in the accompanying chart. In other words, the probability that equities will outperform bonds after inflation over the next decade is low.
This is not a call for alarmism.
And certainly not a call to “sell everything.”
Rather, it is a reminder to temper return expectations, respect market cycles, and recognize that elevated valuations always come at a cost.